The latest rise in interest rates is already having impact on the on housing affordability. As rates rise, mortgage payments on new and existing home sales go up as well. Even though interest rates are still incredibly low. That being said, we wanted to analyze how the move in the 10-Year Treasury hitting 2.50% for the first time since August of 2011 is going to impact the mortgage costs for borrowers.
For starters, many banks are still requiring a 20% down and we are no changing that figure for calculations. The daily mortgage rates advertised at Bankrate.com showed rates ranging from 4.25% up to 4.85%. We decided to use an average home price of $300,000 since the U.S. Census Bureau showed the average home price peaking above $300,000 before the recession and with prices up handily since the last measurement of $272,900 from 2012. We broke this out in a smaller table below.
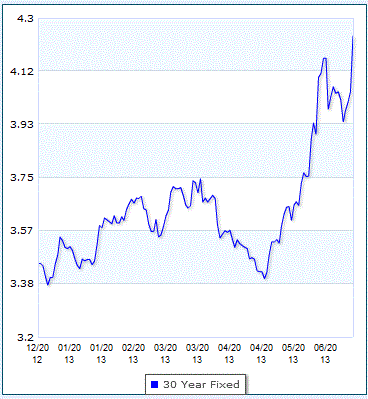
The graph here from Bankrate.com shows that 30-year mortgage rates are getting up to 4.25%, but they were down at 3.50% less than sixty days ago. So on a $300,000 house here is the change in payments after deducting your 20% down and not considering your property tax payments:
- $240,000 at 3.50% is $1,077.71 Per Month
- $240,000 at 3.75% is $1,111.48 Per Month
- $240,000 at 4.00% is $1,145.80 Per Month
- $240,000 at 4.25% is $1,180.66 Per Month
- $240,000 at 4.50% is $1,216.04 Per Month
Now, let’s pretend rates keep rising and home prices do not go down. That may seem unlikely, but many shortages still exist in local markets. Lets pretend that rates keep climbing:
- $240,000 at 5.00% is $1,288.37 Per Month
- $240,000 at 6.00% is $1,438.92 Per Month
The rise we have already seen translates to $102.95 per month for a $300,000 house with 20% down. That in turn translates to $1235.40 more paid for the same per year for each house.
If interest rates rise at the same rate they have in the last 60 days or so, then 5% mortgage rates are a reality. At that point, the latest data from May would imply that almost 5.2 million existing home buyers (not including new homes) would each be paying an average of about $210.66 per month more or $2,527.92 per year more.
There may be one small silver lining that comes along with these higher interest rates. As interest rates rise, banks are more eager to lend money. So even though the price of your mortgage may be higher than a month ago you might find your mortgage banker a bit more able to get you qualified for the loan.
From that Census table, here are the average housing prices in America per year from 1963 to 2010:
- 1963 $19,300
- 1964 $20,500
- 1965 $21,500
- 1966 $23,300
- 1967 $24,600
- 1968 $26,600
- 1969 $27,900
- 1970 $26,600
- 1971 $28,300
- 1972 $30,500
- 1973 $35,500
- 1974 $38,900
- 1975 $42,600
- 1976 $48,000
- 1977 $54,200
- 1978 $62,500
- 1979 $71,800
- 1980 $76,400
- 1981 $83,000
- 1982 $83,900
- 1983 $89,800
- 1984 $97,600
- 1985 $100,800
- 1986 $111,900
- 1987 $127,200
- 1988 $138,300
- 1989 $148,800
- 1990 $149,800
- 1991 $147,200
- 1992 $144,100
- 1993 $147,700
- 1994 $154,500
- 1995 $158,700
- 1996 $166,400
- 1997 $176,200
- 1998 $181,900
- 1999 $195,600
- 2000 $207,000
- 2001 $213,200
- 2002 $228,700
- 2003 $246,300
- 2004 $274,500
- 2005 $297,000
- 2006 $305,900
- 2007 $313,600
- 2008 $292,600
- 2009 $270,900
- 2010 $272,900
Read more: The Real Cost: Rising Interest Rates and Monthly Mortgage Payments – 24/7 Wall St. http://247wallst.com/housing/2013/06/21/the-real-cost-rising-interest-rates-and-monthly-mortgage-payments/#ixzz2ZzkwnLm1
Tags: America, average housing prices, Banks, home prices, housing affordability, interest rates, mortgage payments
 Oxstones Investment Club™