 Oxstones Investment Club™
Nearly twice as many new businesses were started in the five boroughs in 2011 than in 1991, and the lion’s share were started outside of Manhattan.
by Adam Forman, Matthew Claro and Jonathan Bowles
Much attention has been paid to the dramatic growth in tech startups in New York City over the past five years. But the amazing rise of Silicon Alley represents just one part of an incredible 20-year explosion in new entrepreneurial ventures in the five boroughs. In fact, nearly twice as many new businesses were incorporated in the city in 2011 than in 1991—and, interestingly, the fastest growth in startups over the past two decades has occurred outside of Manhattan.
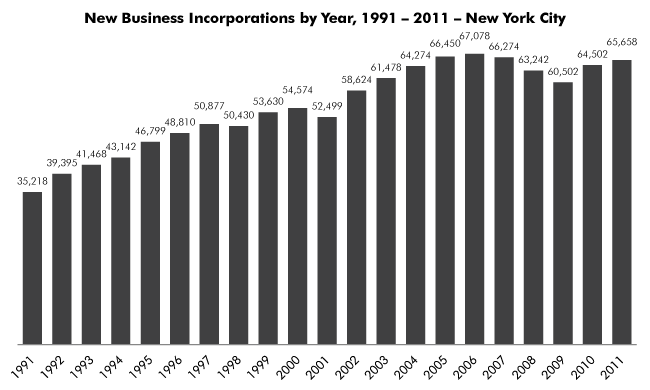
In 2011, an astounding 65,658 businesses filed incorporation papers in New York City, an 86 percent jump from 1991, when just 35,218 businesses opened their doors. Of all the boroughs, Manhattan boasts the largest number of startups incorporated in 2011 (22,756) and the most startups per capita (143 startups per 10,000 residents). However, the Bronx experienced the fastest growth over the past two decades (a 305 percent increase) while Brooklyn was the only borough to see a spike in new business incorporations in the post-recession period of 2007 to 2011.
The following are some key findings from our analysis, which is based on a review of data from the New York State Department of State showing the number of new business incorporations every year between 1991 and 2011:
- In 1991, 35,218 new businesses filed incorporation papers in New York City. By 2011, the number of new business incorporations in the city had increased to 65,658, an 86 percent increase.
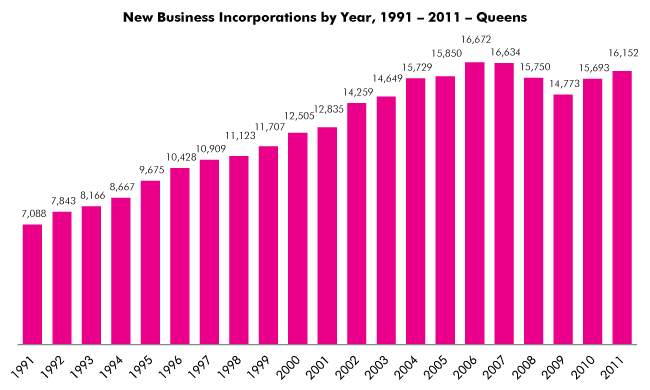
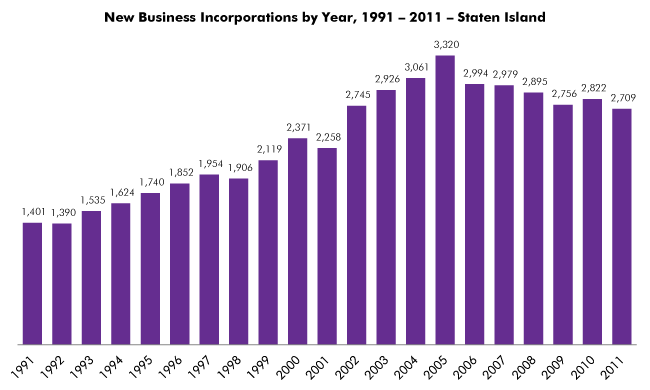
- Of all the boroughs, Manhattan has boasted the most newly incorporated businesses every year from 1991 to 2011. In 2011, 22,756 companies were launched in Manhattan. This was followed by Brooklyn (with 19,351 new incorporations), Queens (16,152), the Bronx (4,690), and Staten Island (2,709).
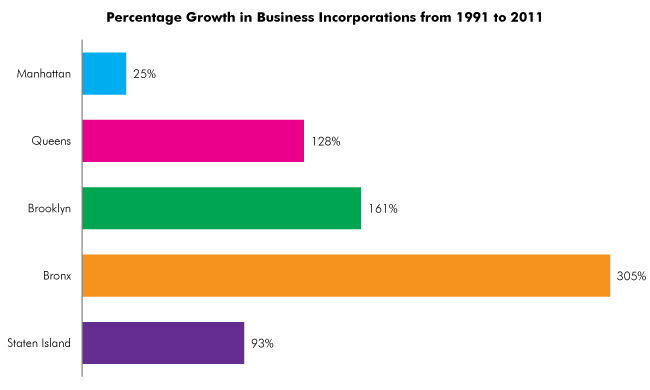
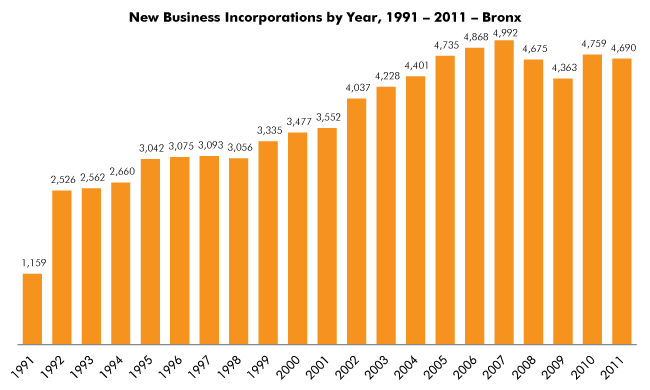
- Of all the boroughs, the Bronx had the fastest growth in new business incorporations between 1991 and 2011, with a 305 percent jump—going from 1,159 newly formed businesses in 1991 to 4,690 in 2011.
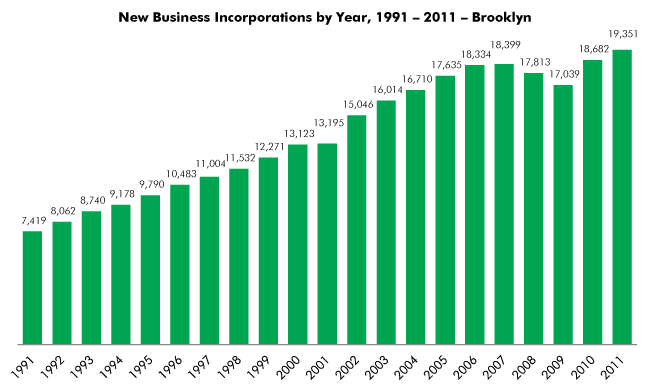
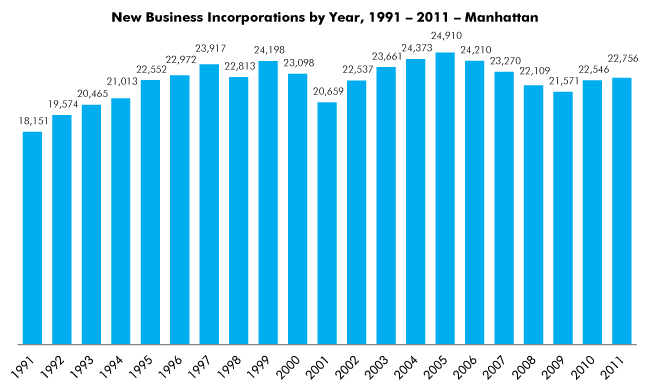
- Brooklyn had the second fastest growth in startups during this period, increasing 161 percent (from 7,419 new businesses in 1991 to 19,351 in 2011). This was followed by Queens, with a 128 percent increase (from 7,088 to 16,152), and Staten Island, which had a 93 percent gain (from 1,401 to 2,709). Manhattan had by far the slowest growth in startups during this period, only increasing 25 percent—from 18,151 new businesses in 1991 to 22,756 in 2011.
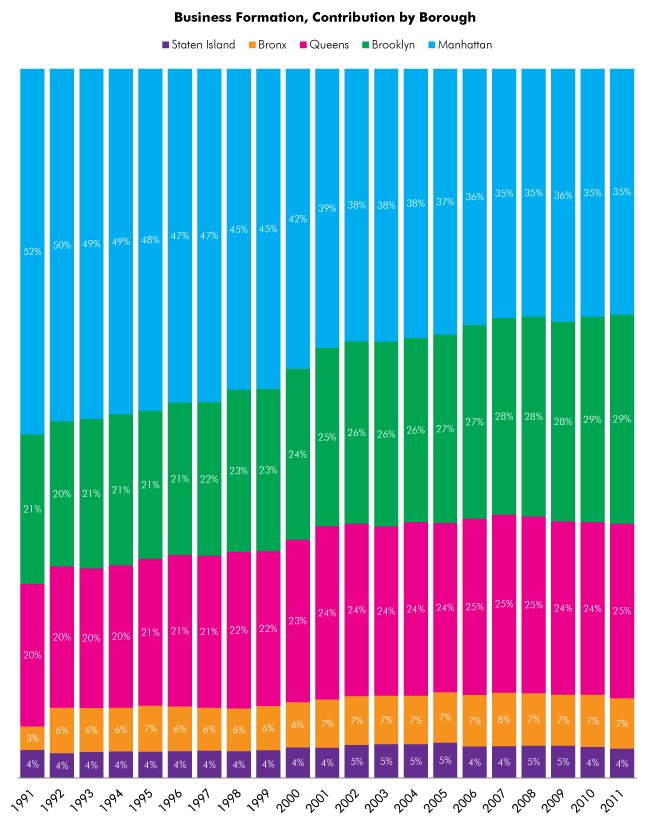
- In 1991, Manhattan accounted for 52 percent of the city’s newly incorporated startups. In 2011, that share dropped to 35 percent. Today, Brooklyn accounts for 30 percent, Queens for 25 percent, Bronx for 7 percent, and Staten Island for 4 percent.
- The number of new business formations in the city declined by 9 percent from 2007 to 2009, going from 66,274 newly incorporated companies in 2007 to 60,502 in 2009. However, new business formation increased by 9 percent from 2009 to 2011.
- Brooklyn is the only borough to register an increase in the number of startups between 2007 and 2011. It experienced a 5 percent gain in newly incorporated companies during this period, compared to declines in Staten Island (-9 percent), the Bronx (-6 percent), Queens (-3 percent), Manhattan (-2 percent) and citywide (-1 percent).
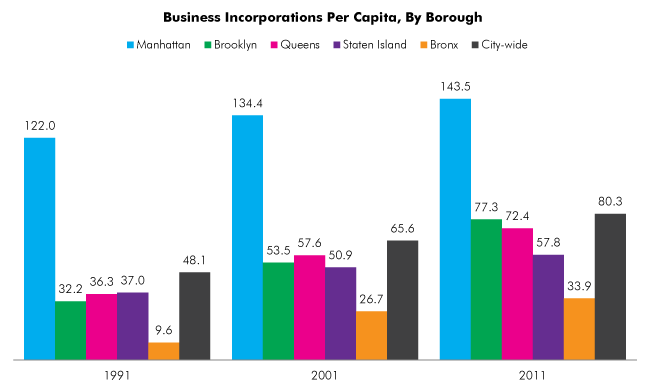
- Manhattan has the most start-ups per capita. For every 10,000 working age adults (18-65), there were 201 start-ups in 2011. The corresponding figures were 119 in Brooklyn, 109 in Queens, 90 in Staten Island, and 54 in the Bronx.
- In 1991, Brooklyn trailed Manhattan, Queens and Staten Island in startups per capita. Today, it outpaces all but Manhattan. The number of Brooklyn startups was a mere 40.9 percent of Manhattan’s total in 1991. By 2011, that share rose to 85 percent.
| Business Incorporations by Borough, 1991 – 2011 | ||||||
|---|---|---|---|---|---|---|
| Year | Staten Island | Bronx | Brooklyn | Queens | Manhattan | City |
| 1991 | 1,401 | 1,159 | 7,419 | 7,088 | 18,151 | 35,218 |
| 1992 | 1,390 | 2,526 | 8,062 | 7,843 | 19,574 | 39,395 |
| 1993 | 1,535 | 2,562 | 8,740 | 8,166 | 20,465 | 41,468 |
| 1994 | 1,624 | 2,660 | 9,178 | 8,667 | 21,013 | 43,142 |
| 1995 | 1,740 | 3,042 | 9,790 | 9,675 | 22,552 | 46,799 |
| 1996 | 1,852 | 3,075 | 10,483 | 10,428 | 22,972 | 48,810 |
| 1997 | 1,954 | 3,093 | 11,004 | 10,909 | 23,917 | 50,877 |
| 1998 | 1,906 | 3,056 | 11,532 | 11,123 | 22,813 | 50,430 |
| 1999 | 2,119 | 3,335 | 12,271 | 11,707 | 24,198 | 53,630 |
| 2000 | 2,371 | 3,477 | 13,123 | 12,505 | 23,098 | 54,574 |
| 2001 | 2,258 | 3,552 | 13,195 | 12,835 | 20,659 | 52,499 |
| 2002 | 2,745 | 4,037 | 15,046 | 14,259 | 22,537 | 58,624 |
| 2003 | 2,926 | 4,228 | 16,014 | 14,649 | 23,661 | 61,478 |
| 2004 | 3,061 | 4,401 | 16,710 | 15,729 | 24,373 | 64,274 |
| 2005 | 3,320 | 4,735 | 17,635 | 15,850 | 24,910 | 66,450 |
| 2006 | 2,994 | 4,868 | 18,334 | 16,672 | 24,210 | 67,078 |
| 2007 | 2,979 | 4,992 | 18,399 | 16,634 | 23,270 | 66,274 |
| 2008 | 2,895 | 4,675 | 17,813 | 15,750 | 22,109 | 63,242 |
| 2009 | 2,756 | 4,363 | 17,039 | 14,773 | 21,571 | 60,502 |
| 2010 | 2,822 | 4,759 | 18,682 | 15,693 | 22,546 | 64,502 |
| 2011 | 2,709 | 4,690 | 19,351 | 16,152 | 22,756 | 65,658 |
Tags: boroughs, Bronx, Brooklyn, business incorporations, data, economic growth, entrepreneurship, Manhattan, new entrepreneurial ventures, New York City, Queens, Staten Island