 Oxstones Investment Club™
Each Friday the Commodity Futures Trading Commission (CFTC) releases the latest batch of Commitment of Traders (COT) data which can be downloaded from their website. Each trader is designated as a Commercial or Non-Commercial Trader. If you use futures as a hedge within your business, for example an agriculture company may want to hedge the exposure to corn or wheat prices, then your trades are marked as being transacted by a Commercial Trader. The other two categories are Large Traders and Small Traders. Large Traders are often hedge funds, CTAs, or other types of investment firms or pensions. While Small Traders are those who may be trading odd lots or smaller size positions. Since Commercial Traders are those who likely use the commodity they are hedging, they are often called the “smart money” since they often know the most about that particular market. This “smart money” title is not always a correct description and I’ll show some examples of why later on.
Below I want to show a few examples of how I use the COT data. There will be quite a few charts, but bear with me.
Large Traders Going Net-Long
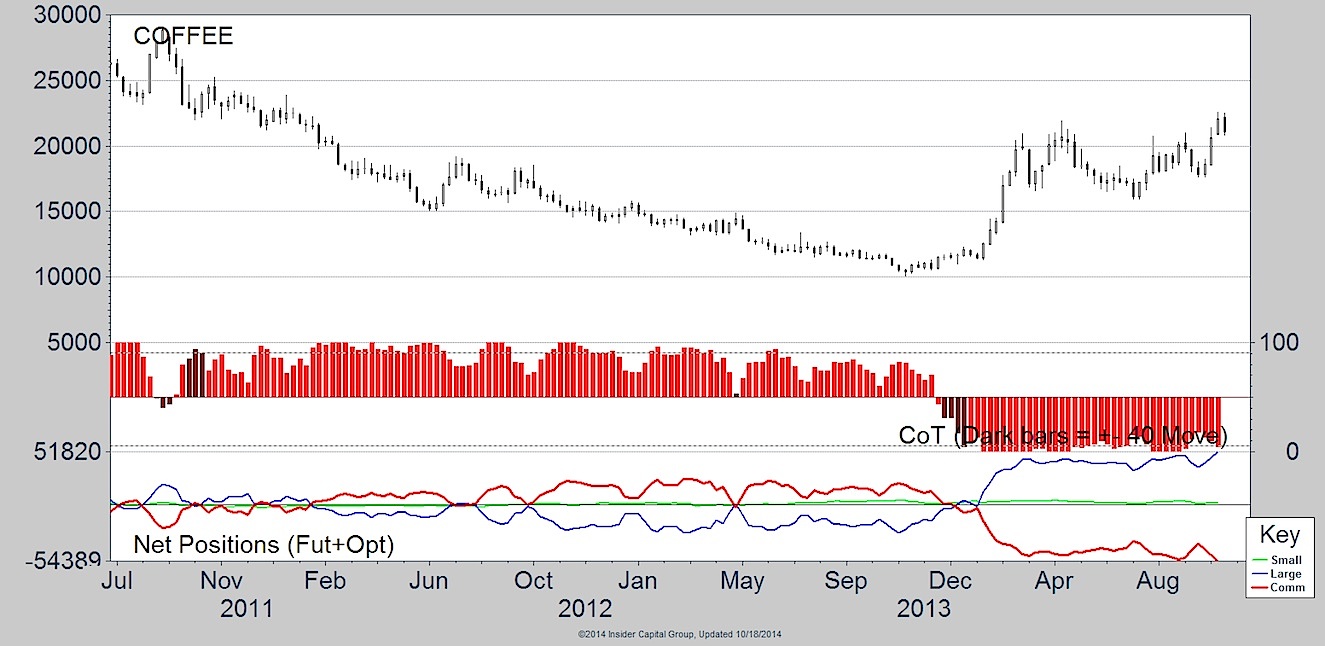
This chart shows the weekly price action of Coffee. In the bottom panel, and like all the other charts that will follow, show the movement in the net-position of the Commercial, Large, and Small Traders.
You’ll notice that the blue line, which represents the net-position of Large Traders is often below zero as they have often been net-short Coffee. However in early 2014 we saw a Large Traders shift their position to net-long, and continued to add to it as the price of Coffee rose. Since many CTAs and other traders who fall in the Large Trader category are often trend followers, it’s typical to see this category move in the same direction as price. But what’s important in this example was the shift from net-short to net-long.
Coffee prices eventually rose over 90% in just four months after this change in position took place!
Commercial Traders Going Net-Long
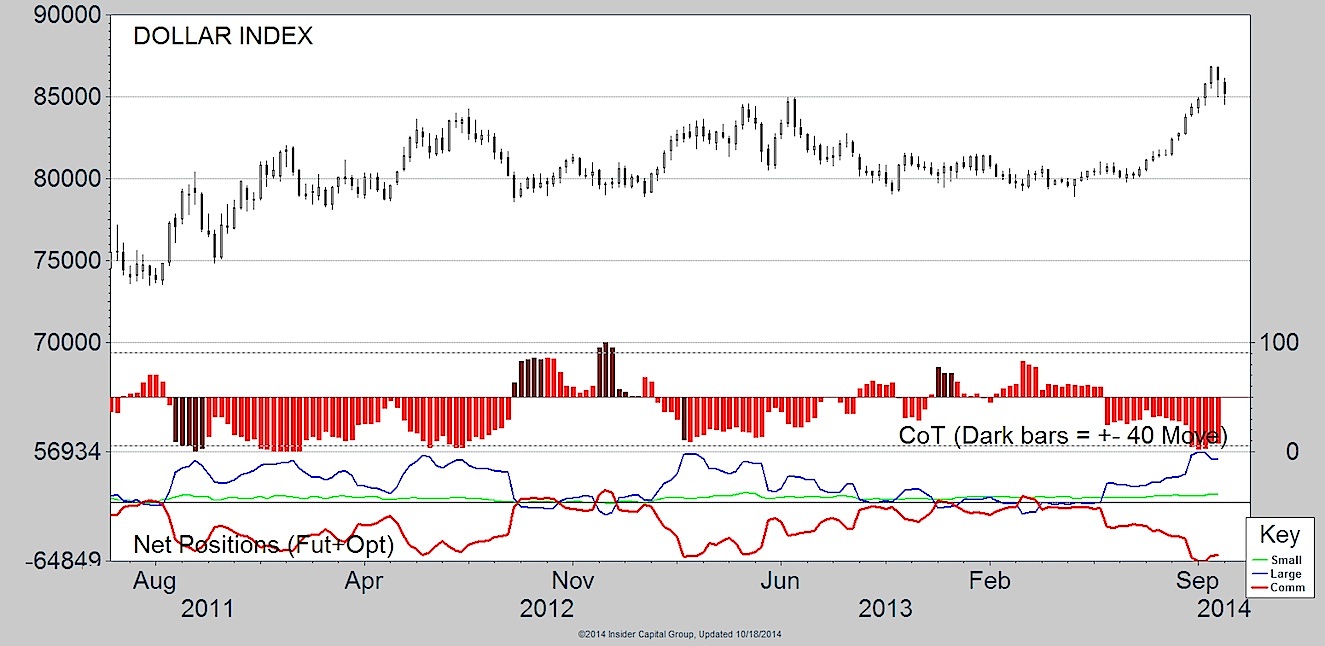
Like the above example of Large Traders flipping net-long, we can see this type of bullish action also take place for Commercial Traders. This time we are looking at a weekly chart of the U.S. Dollar going back the last three years. You can see that the red line, the Commercial Traders, are often net-short the Dollar. However, when this changes and they become net-long the dollar has bottomed and put in at least a short-term rally. This has often been followed by the Large Traders jumping on the trend and moving their net-position up as well. The past rallies in the Dollar have begun to wane when the Large Trader net-long position has gotten to its current level. We’ll see if this puts a stop to the advance in the U.S. currency.
Another great example of a market being buoyed by the Commercial Trader is the Dow Jones Industrial Average futures market. It’s rare to see the Commercial traders become net-long; but when they have or at least gotten close (and while it typically only lasts a couple of weeks) the equity index has rebounded.

Large Traders Continuing A Trend
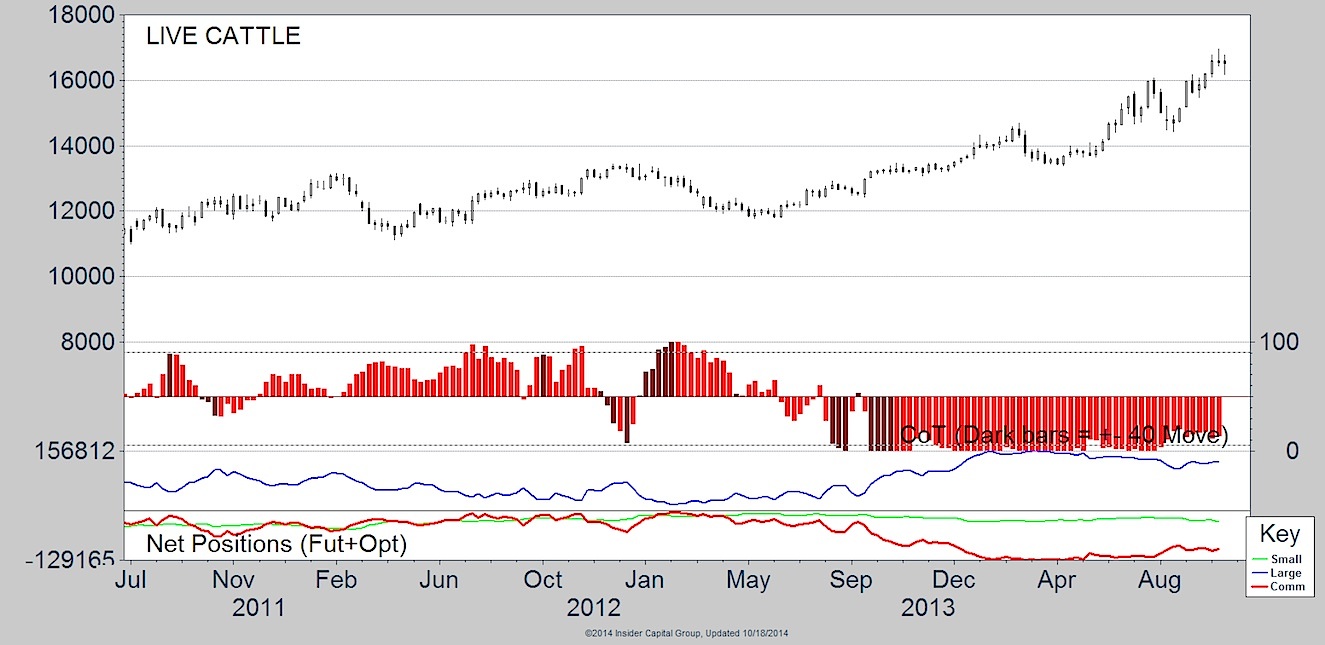
The third way I will use COT data is for trend continuation confirmation. As I said earlier, the Large Trader category is often made up of trend followers. We can use that to help confirm the ‘health’ of a trend. Below is a chart of Live Cattle futures. Since mid-2012 there’s been a well-defined up trend in the Live Cattle market. As the bottom panel of the chart shows, Large Traders have been net-long this market for quite a while. However, during the most recent run that’s lasted almost two years, the net-long position of Large Traders has stayed consistently high. While the data set has some degree of movement, for the most part Large Traders have maintained their long-bias for Live Cattle futures.
When COT Data Gets it Wrong
While this data set of trader positions can be extremely helpful in looking for turning points, it by no means is the holy grail to trading. Because of that, I want to show this next chart of Soybeans. Like the examples I used above for of the Dow and the Dollar, in the past when Commercial traders got net-long Soybeans, the futures market would rally. We saw examples of this in 2011 and 2013. But this year we’ve seen the spot price of Soybeans drop 40% from its May high. In June we saw the Commercials move their position to net-long. And I, like many traders, thought this was a good sign for Soybeans and began looking for the 2012 low to act as support. Price did not rebound, and in fact selling has intensified to some degree. Since June, the Commercial Traders have continued to boost their net-long exposure.

The above-mentioned examples of how to use COT data are just a few scratches to the surface of how this data can be used. While the changes in net-position of different trader categories can lead to changes in trend, this is not a perfect science or method. However, for those that rely on price action and technical analysis methods to determine their bias for certain markets, COT data can be an invaluable tool in their toolbox.
Follow Andrew on Twitter: @AndrewThrasher
The information contained in this article should not be construed as investment advice, research, or an offer to buy or sell securities. Everything written here is meant for educational and entertainment purposes only. I or my affiliates may hold positions in securities mentioned.
Any opinions expressed herein are solely those of the author, and do not in any way represent the views or opinions of any other person or entity.
Market Masters: Using COT Data To Identify Turning Points In The Market
Tags: CFTC, commercial Traders, Commitment of Traders, Commodity Futures Trading Commission, COT, COT data, Dow Jones Industrial Average futures market, education, hedge funds, large traders, Live Cattle futures, small traders, technical analysis, trader categories, trader positions, trend changes